Your audience raves about you. Help them discover and share your best content too.
Facebook is the social network to end all social networks. At least, we have a bit of evidence to support that claim.
In the 2nd Quarter 2014 edition of the Shareaholic Social Media Traffic Report, we reveal data that demonstrates Facebook’s absolute dominance as the leading driver of social referrals to sites across the web. Year-over-year, its “share of visits,” a percentage of overall traffic — direct traffic, social referrals, organic search, paid search, etc. — sites received, skyrocketed, even as it has decreased brands’ organic reach.
This April, we crowned Facebook and Pinterest king and queen of social referrals. As it stands, that is still true. That said, our updated figures will still surprise you.
Our newest study, which focuses on how much traffic the 8 most popular social media platforms referred to our network of sites*, is broken up into two main parts:
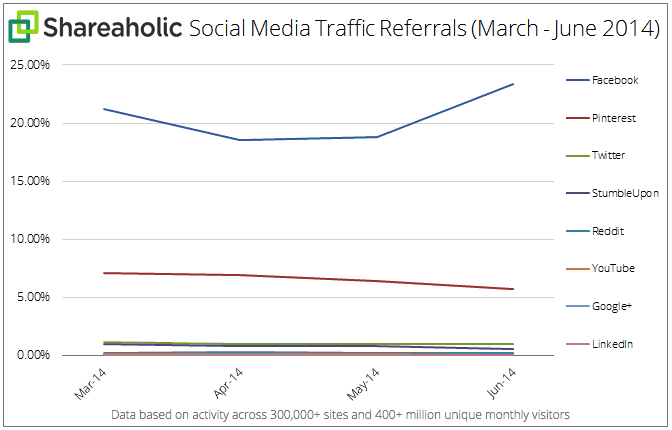
- Section I: Social referrals over Q2 2014 (March – June 2014) — A brief look at four months of data collected from 300,000+ websites reaching a global audience of more than 400 million unique visitors.**
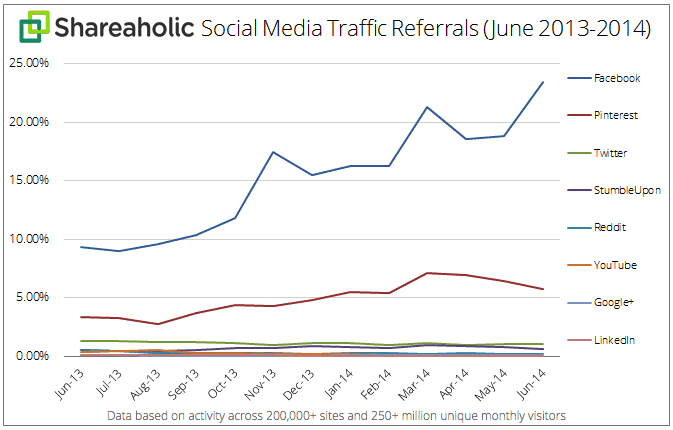
- Section II: Social referrals year-over-year (June 2013-2014) — A deeper analysis of thirteen months of data collected from 200,000+ websites reaching a global audience of more than 250 million unique visitors.**
Let’s dig into the numbers.
Section I: Social Referrals Over Q2 2014
Our first chart observes “share of visits” for each social network over the months of March, April, May, and June 2014. The final column quantifies how much each social platform’s share has changed from March (end of Q1) through June (end of Q2).
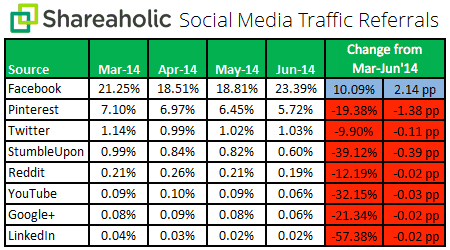
Of the top 8 social networks, only Facebook drove a greater share of traffic at the end of Q2 than it did at the end of Q1.
By increasing its share 10.09% (2.14 percentage points), it may be fair to suggest that Facebook stole share from the seven remaining social networks, which lost a collective 1.97 percentage points.
To understand if this was part of a greater, lasting trend, we also decided to look at how “share of visits” changed year-over-year.
Section II: Social Referrals Year-Over-Year
Social media is now a well-developed and highly sophisticated medium.
Within seconds, a 140-character message can be shared across the world, in real time. In extreme cases, social media helps pioneer revolutions. For everyday users, it’s a means of discovering and sharing content and stories that matter to them — and that leads to valuable traffic for businesses and publishers.
But how has social media as a source of traffic changed in the past 13 months? The answer is in the numbers below (click to enlarge):
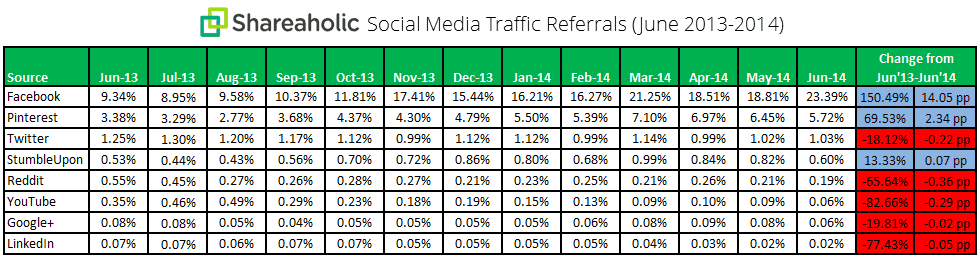
Together, the 8 largest sources of social referrals drove 31.07% of overall traffic sites received last month. Compare that to 15.55% during the same time last year.
Year-over-year, only 3 social networks (Facebook, Pinterest and StumbleUpon) saw their “share of traffic” grow. The other 5 (Twitter, Reddit, YouTube, Google+, and LinkedIn) saw their shares steadily decline or sharply nosedive, as is the case with Reddit, YouTube and LinkedIn.
Here are a few key takeaways from this report:
1) Facebook is, by an extremely wide margin, the #1 source of social referrals
- Easily the largest social network, Facebook commands the most clout among marketers and publishers hungry for referrals. Well-positioned for world domination, Facebook now drives nearly a quarter (23.39%) of overall traffic to sites and has no plans of stopping anytime soon. Over the last year, its “share of traffic” has skyrocketed, up 150.49% (14.05 percentage points) from 9.34% in June 2013.
- A social network is only as good as the connections is fosters and supports. Fortunately, for Facebook, users depend on the ubiquitous social network to communicate individually and wholesale with friends. In fact, 64% of Facebook users visit the site on a daily basis, according to Pew Research.
- Users are always plugged into their feed and without realizing, tend to be highly invested in frequent check-ins and lightweight touch points with their connections. Simply put, Facebook is winning the referrals war because users can’t seem to get enough of content shared by close friends and relatable acquaintances.
- Facebook’s rich, and somewhat unpredictable feed promises anything but monotony. Multi-form media (short posts, long rants, link previews, unformatted links without previews, etc.) offers inconsistency which makes it impossible to scroll far without at least a handful of posts catching your eye.
- Also, I’ve said it before and I’ll say it again. Even deleting your Page and hating on Facebook for limiting brands’ organic reach can get you 27,000 likes and shares on the platform you so vehemently denounce. Am I right, Eat24?
2) Pinterest, the reigning queen saw its share peak in March
- In March, Pinterest was responsible for 7.10% of all visits sites received. Last month, its share of traffic was only 5.72% though. Has it hit a plateau? It’s too early to tell. Year-over-year, the image-friendly social platform saw its share grow 69.53% (2.34 percentage points), up from 3.38% overall. Arguably, this is only a temporary decline as it figures out the perfect balance between the amount of promoted pins and organic pins users see. It is premature to think Pinterest’s bubble is due to burst; the four year old social network has barely moved on from its training wheels.
- What’s Pinterest’s advantage? Compelling visual content wins, time and time again. That’s why brands love the platform. It allows them to showcase their best products in front of an audience excited to discover things that fit users’ personal aesthetic. Images do wonders to arouse curiosity and encourage action. Take, for instance, this study by Piqora which calculated the value of a Pin at 78 cents. Not bad, if you ask me.
3) Twitter hangs steady in 3rd place
- Over the last 13 months, Twitter’s share reached a high of 1.30% and dipped to a low of 0.99%. Last month, sites across the web only sourced 1.03% of their overall traffic from Twitter, which is down 18.12% (0.22 percentage points) from the same time a year ago.
- Why is Twitter falling behind in referrals? For one, constrained media has its limitations. Though tweeps love that messages are short and succinct, there is only so much you can fit in each 140-character tweet. Because of that, feeds tend to look the same — lines of text and links broken only by the occasional emoji, image, GIF, Vine, or video.
- Loosely-based connections make it tough to care about everyone’s tweet, and since users may post more updates here and may follow more people than they have friends on Facebook, feeds end up being a flooded sea of content. The overwhelmed feed means even as the network grows, fewer tweets will actually be read (and clicked).
- More and more, businesses are using Twitter for branding more than for traffic acquisition. Take, for instance, the now iconic “Dunk in the Dark” tweet by Oreo, Ellen’s selfie at the Oscars and, more recently, Snickers’ “More satisfying than Italian” tweet during the World Cup.
4) StumbleUpon manages to fare well and hold a strong 4th position
- In the last 13 months StumbleUpon’s share of traffic peaked just shy of 1% in March 2014. Growing slightly year-over-year, last month, it drove a modest 0.60% of overall traffic to sites, up 13.33% (0.07 percentage points) from 0.53% in June 2013.
- Content discovery continues to be a huge and growing space. Though because of limited opportunity for users to “engage” with the platform, marketers and publishers will have to cross their fingers hoping their stories will be recommended, over and over again, to StumbleUpon’s plethora of content-hungry users.
5) Reddit is still a tough cookie to crack
- Over the last year, Reddit has seen a stark decline in the overall share of visits it sends sites’ way. Starting at a 13-month high of 0.55% in June 2013, its share quickly sunk to 0.27% in August and hasn’t recovered since, finally hitting a low of 0.19% last month. Year-over-year, its share shrunk 65.64% (a loss of 0.36 percentage points).
- In January, I published a somewhat controversial report (perhaps unfairly) singling out the notoriously snark-filled platform for hoarding its traffic and users, though one may argue Reddit is awfully generous to a select number of sites for whom it delivers vast amounts of outbound traffic (namely Imgur.com). What’s more is that Reddit itself has become a destination for sourcing stories. For example, here are listicles curated by Buzzfeed and Mashable via Reddit threads. In many ways, Reddit has become news. Although many links are still shared, there are far fewer threads that highlight ONE link (many threads will include tons of links in the discussion but fewer threads are created around a single link). For example, this is a top post from 2012 which is entirely a user-generated compilation of outbound links.
- Ultimately, a platform’s potential is really is what you make of it. For those that know how to effectively engage Redditors (without releasing the trolls), Reddit can be an invaluable community. In the aggregate though, it’s not one you can rely on to passively provide traffic.
6) For the average publisher, YouTube, Google+ and LinkedIn are going nowhere fast as sources of valued referrals
- In June 2014, “share of visits” for YouTube, Google+ and LinkedIn were 0.06%, 0.06% and 0.02%, respectively. YouTube and LinkedIn saw their shares take a dramatic turn for the worse in the past year, shrinking 82.66% (0.29 percentage points) and 77.43% (0.05 percentage points). Google+ fared a bit better, shedding a mere 19.81% (0.02 percentage points) of its share of traffic year-over-year. On the plus side, YouTube, Google+ and LinkedIn offer the most engaged social media post-click referrals.
- For the majority of marketers and publishers, YouTube is not a significant driver of traffic because not all businesses have the sufficient resources to develop high-quality videos their audiences want to see and share. Making good videos is prohibitively expensive. It also requires lots of skilled talent. Among the few that have developed popular YouTube channels, it’s a traffic gold mine.
- Google+ is an odd beast with an incredibly dedicated community of core users. But it simply doesn’t have the size or carry the same influence as competing social platforms. Arriving late to the game, Google Plus failed to grow user adoption of the platform since most marketers and publishers still do not quite understand its value and are likely overwhelmed managing their already claimed and robust Facebook and Twitter accounts. As Marketing Land’s Martin Beck puts it, “[Google+ is] not a ghost town, but a social referral graveyard.”
- I’ve gone back-and-forth on LinkedIn. More recently, I’ve been optimistic about the potential of its open publishing platform. That said, since users still report not having access to pen posts (or they simply haven’t noticed the change on their account), sites across the web have yet to realize the power of authoring and syndicating content on LinkedIn. Of course, even that might not move the needle for the social platform that’s seen such a dramatic decline in share of visits years-over-year. It is quite possible that, like Reddit, LinkedIn is becoming more a source for stories. Anecdotally, I find myself referencing posts from LinkedIn Influencers I admire in articles I publish. Firsthand, I’ve also seen a ton of engagement in group or status update threads and in the comments of posts. Is there a chance LinkedIn has become insular? I would think so. But another diagnosis of LinkedIn’s anemia can be that its “professionals only” image is deterring many users from taking full advantage of the platform. Even those that can benefit the most from LinkedIn shun it.
What dramatic traffic trends have you noticed over Q2 or in the past year? Also, if you’re a fan of our data reports, subscribe to our blog so you won’t miss out on the next one. For questions related to this or any other Shareaholic reports, please contact press@shareaholic.com.
* Shareaholic sources data from a network of opt-in websites that utilize its content marketing and publishing tools. Our sites are fairly diverse, spread across tens of different head categories (e.g. food, tech, design, fashion and beauty, marketing, sports, parenting, religion, general news, and many, many more), with sites ranging from independent lifestyle blogs to publishing companies to commerce sites. Furthermore, the size of websites participating in this study varies. Some receive less than 1,000 unique visitors each month while others pull in millions.
** Our methodology is unique in that we utilize a proprietary network of opt-in websites that continues to grow. Rather than working solely with a static list, we take advantage of an expanding data set which is why our sample size for Q2 (300k+ sites reaching 400M+ users) is larger than that for our year-over-year analysis (200k+ sites reaching 250M+ users).

Love what we do at Shareaholic? Join the team or refer a friend.