Make money from your hard-earned pageviews. Monetize your passion with Promoted Content by Shareaholic.
Social media platforms are eating every other traffic source’s lunch. Formerly, organic search (i.e. Google, Bing, Yahoo, etc.) made up the lion’s share of overall visits to sites.
In 2014, the tables turned.
Data (which we also shared with BuzzFeed) confirms, “The shift from search to social isn’t just in progress: it’s already here.” Collectively, the top 8 social networks drove 31.24% of overall traffic to sites in December 2014, up from 22.71% the same time last year. This is significant as brands, publishers and marketers finalize budgets to power a successful 2015.
Over the years (and in 2014, especially), our media consumption habits have changed dramatically. We rely less on homepages and search engines, discovering news pertinent to us through social media and direct messaging on mobile apps.
In the latest edition of the Shareaholic Social Media Traffic Report, we take a precise look at how much traffic each of the top 8 social networks drove to publisher sites across the web. The data reveals “share of visits,” a percentage of overall traffic — direct traffic, social referrals, organic search, paid search, etc. — sites received, for Facebook, Pinterest, Twitter, StumbleUpon, Reddit, Google Plus, LinkedIn, and YouTube.
Our latest report, which aggregates data from Shareaholic’s network of sites*, is broken up into three main parts:
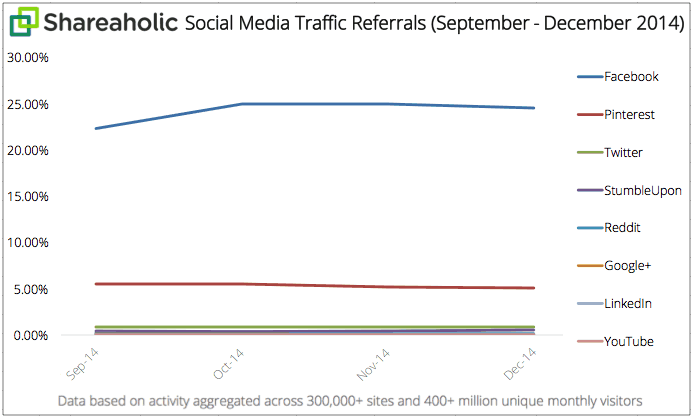
- Section I: Social referrals over Q4 2014 (September – December 2014) – A brief look at 4 months of data collected from 300,000+ websites reaching a global audience of more than 400 million unique monthly visitors.**
- Section II: Social referrals Year-over-Year for 2014 (December 2013-2014) – A review of 13 months of data collected from 300,000+ websites reaching a global audience of more than 400 million unique monthly visitors.**
- Section III: Social referrals over 3 years to understand greater historical trends (December 2011-2014) – An in-depth analysis of 37 months of data collected from 150,000+ websites reaching a global audience of more than 200 million unique monthly visitors.**
Without further ado…
Section I: Social Referrals over Q4 2014
First, we have “share of visits” for each social platform over September, October, November, and December 2014. Data for September is provided for comparison purposes. The final column quantifies how much each social platform’s respective share has changed since the end of Q3 (September) up until the end of Q4 (December).
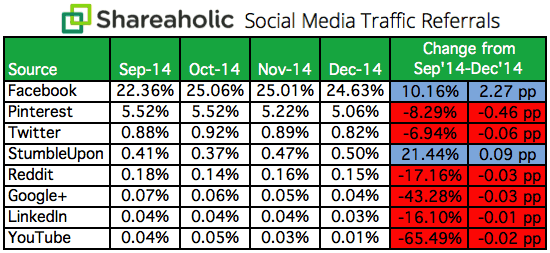
In Q4, only two platforms — Facebook and StumbleUpon — grew their share of traffic. Share for the remaining six social networks shrunk during this time, between 0.46 – 0.01 percentage points.
Facebook continues to dominate the charts with few real challengers. Its 24.63% share of traffic makes Pinterest, which drives 5.06% of overall visits to sites around the web, a distant runner-up. Twitter, in third place, captures a 0.82% share. This alone is more than the aggregate traffic the five other social networks send to publishers.
Section II: Social Referrals in FY 2014
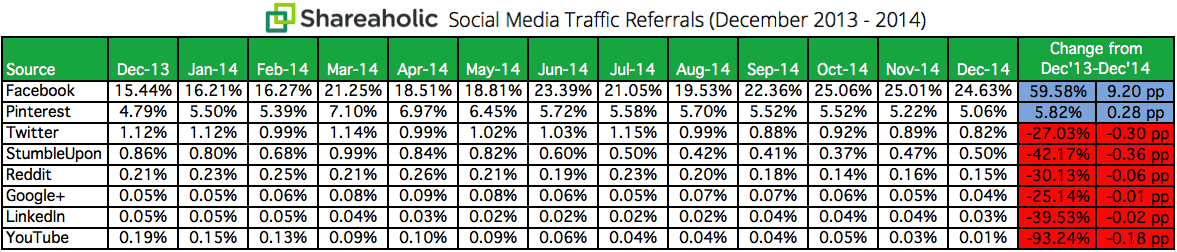
Over the past 13 months, both Facebook and Pinterest have demonstrated the potential of their respective platforms to marketers, publishers and site owners. Year-over-year, they’ve been the only social networks to experience growth in their “share of traffic.” But the difference in growth is remarkable. Facebook’s share rose 59.58% (9.20 percentage points) peaking at 25.06% in October 2014. Pinterest experienced far more modest growth — a 5.82% year-over-year increase (0.28 percentage points). Its share hit an all-time high of 7.10% in March 2014 and has seen steady decline since.
(click above image to enlarge)
The remaining six (Twitter, StumbleUpon, Reddit, Google Plus, LinkedIn, and YouTube) saw their shares dip year-over-year by more than 25%. YouTube was the year’s biggest loser; its share was annihilated, dropping 93.24% (0.18 percentage points). It currently clings onto a 0.01% share of overall traffic.
Section III: Social Referrals from 2011 through 2014
For simplicity’s sake, we’ve highlighted each social network’s respective share for December 2011, 2012, 2013, and 2014 to minimize information overload and control for seasonal fluctuations. The results are startling.
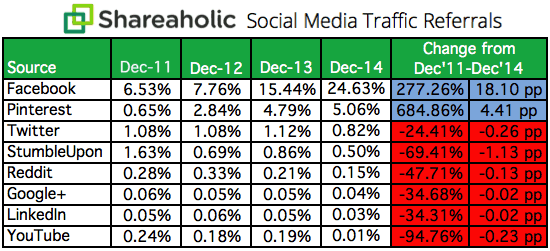
Three noteworthy takeaways include:
1) Facebook drives a 1/4 of overall traffic
- As a platform that knows everything about us (our lives, interests and friends), Facebook dictates the news we read, enables brands to promote targeted messages and offers, and is the #1 source of social referrals to sites around the web.
- Facebook sent 24.63% of the total visits publishers received in December 2014. Its share of traffic swelled 277.26% (18.10 percentage points) since December 2011. Over a comparable time frame, its user base grew 60%, from 845 million monthly active users (Nov 2011) to 1.35 billion (Sep 2014). Facebook’s near 4x explosion in traffic share represents a far more engaged user base. According to Nielsen, Americans spent an average of 15.5 minutes each day on Facebook in August 2011. In November 2014, eMarketer published a study which suggests the average user spends 42.1 minutes each day on the ubiquitous social network.
2) Pinterest hit its plateau
- Pinterest, one of the fastest growing social networks in history and the preferred platform for American women, may have lost its momentum.
- Since December 2011, Pinterest’s share of traffic has skyrocketed 684.86% (4.41 percentage points). Last month, Pinterest delivered 5.06% of total visits to sites across the web, up from 0.65% in 2011. In 2012, it overtook Twitter and StumbleUpon, rising to 2nd place and has dramatically increased its lead over 2013 and 2014.
- Pinterest’s share of traffic hit an all time high in March 2014 at 7.10%. But since then, its share has been in decline. Quantcast reports a similar trend too.
- Principal Analyst at Forrester, Nate Elliott, calls Pinterest a conundrum. Elliot says, “Pinterest is confusing. It’s a bundle of contradictions: at once it offers marketers huge potential and huge frustration.” Select brands recognize its commercial value and have invested big dollars on ‘Pinfluencers’. But the platform has yet to realize its full potential. To do so, it needs to quickly shed its isolating for-women-only image and develop more mass-market appeal.
3) The six remaining platforms make up less than 2% of total web traffic
- Twitter, the 3rd largest referrer of social traffic, contributed 0.82% of overall visits to sites last month. Should marketers, publishers and site owners care about the ‘other’ social networks? Collectively, Twitter, StumbleUpon, Reddit, Google Plus, LinkedIn, and YouTube had a combined 1.55% share of traffic in December 2014. That’s less than 1/3 of the traffic Pinterest sent to publishers and approximately 1/16 of Facebook’s share.
- From December 2011 to December 2013, Twitter’s share of traffic mostly stayed just above 1%. By December 2014, it dipped below single-digits. Twitter’s share is now down 24.41% (0.26 percentage points) from 1.08% at the end of 2011. The company faces a myriad of problems moving forward. Its user growth has slowed, but smart marketers can still utilize advanced strategies to further distribute and promote their content on the platform and inbound traffic.
- Over the past 37 months, StumbleUpon’s share of traffic sunk 69.41% (1.13 percentage points). Formerly the 2nd largest driver of social traffic, StumbleUpon has dropped to 4th place. In December 2011, its share of traffic was 1.63% and last month it was 0.50%. According to the company, StumbleUpon has 30 million users. This means there remains plenty of opportunity for individual brands and publishers to capture tens (or even hundreds) of thousands of views if a single link they share goes viral.
- Reddit’s share of traffic was effectively halved, down 47.71% (0.13 percentage points), over the years. Three years ago, it drove 0.28% of total site traffic; today, it drives 0.15%. Its users are part of an increasingly insular community, and they aren’t fond of brands. But if you have thick skin and will play by the rules, here’s how you can win on Reddit.
- Google’s resilient social network lost one-third (34.68%, 0.02 percentage points) of its share of traffic since the end of 2011. It now sends 0.04% of overall visits to publishers. Mention of Google Plus often sparks polarizing responses. It earns both wholehearted praise from active users and pithy pessimism from non-believers. There is also a large camp — Facebook and Twitter already take up too much of their time — that maintains full ambivalence towards it. To generate more visits from the platform though, you’ll have to commit to regular participation.
- In three years, LinkedIn’s share of traffic also dropped by a third (34.31%, 0.02 percentage points). In December 2011, the world’s largest professional network held a 0.05% traffic share. During the same time last year, that figure was 0.03%. Fortunately, you can still leverage marketing hacks to grow inbound visits from LinkedIn.
- Though YouTube delivers the most engaged social visitors, it drives the fewest. Since 2011, YouTube experienced a sharp drop (94.76%, 0.23 percentage points) in share of traffic. Formerly, it maintained a 0.24% share, which is now a paltry 0.01%. For brands and publishers, video is hard (and expensive) to create, but that’s not stopping anyone. Video is a necessary storytelling medium. The fact is: YouTube is no longer the sole gatekeeper of video views. With auto-play videos, Facebook has cannibalized YouTube’s traffic share. Thankfully, this is more a problem for YouTube than it is for you. To maximize the potential reach of your videos, you can (and should) publish them to Facebook and to YouTube.
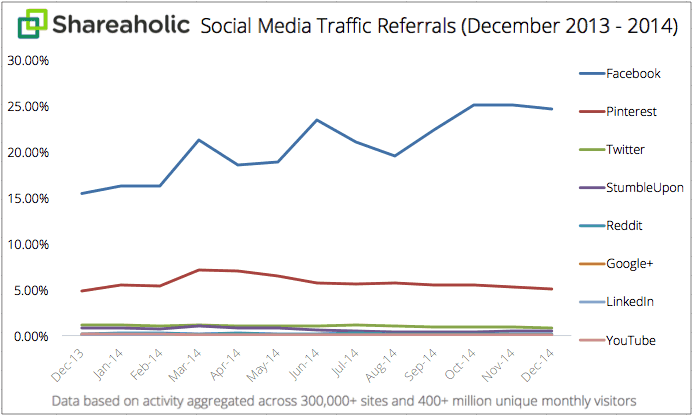
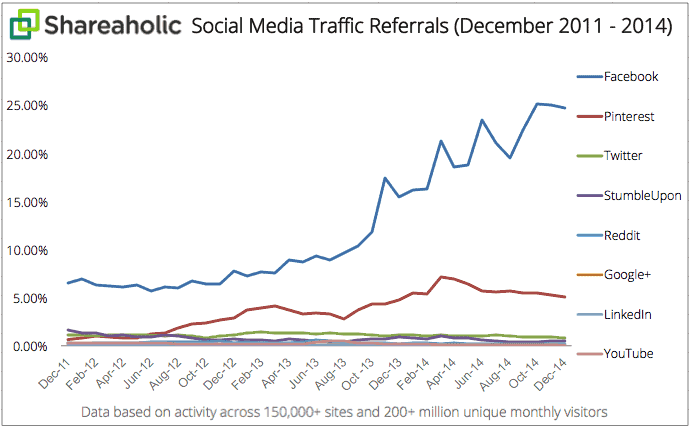
Finally, to admire Facebook’s uncontested dominance, Pinterest’s rapid rise and recent stagnation, and the negligible changes among the other six social platforms, here is our 3-year trend graph.
Have you seen the same social traffic patterns over the years? Share any interesting numbers you find in the comments.
For publishers, Shareaholic provides a dead-simple way to earn revenue from ads on your site. Try out our customizable platform.

Also, if you’re a fan of our data reports, subscribe to our blog so you won’t miss out on the next one. For questions related to this or any other Shareaholic reports, please contact press@shareaholic.com.
* Shareaholic sources data from a network of opt-in websites that utilize its content marketing and publishing tools. Our sites are diverse, spread across tens of different head categories (e.g. food, tech, design, fashion and beauty, marketing, sports, parenting, religion, general news, and many more), with sites ranging from independent blogs to publishing companies to commerce sites. Furthermore, the size of websites participating in this study varies. Some receive less than 1,000 unique visitors each month while others pull in millions.
** Our methodology is unique in that we utilize a proprietary network of opt-in websites that continues to grow. Rather than working solely with a static list, we take advantage of an expanding data set which is why our sample size for 2014 (300k+ sites reaching 400M+ users) is larger than that for our 3 year analysis (150k+ sites reaching 200M+ users).