 Let us help you get more people sharing, grow your fans, make money, and know your readers and site visitors better. Activate Shareaholic for your site now!
Welcome to the latest edition of the Shareaholic Social Media Traffic Report. A full quarter has passed since we published our last study. Now we’re back with more interesting news.
Our findings are based on four months of data collected from over 200,000 websites which reach more than 250 million unique visitors each month.
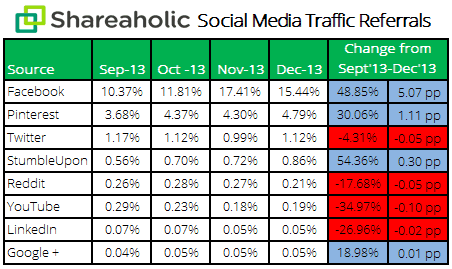
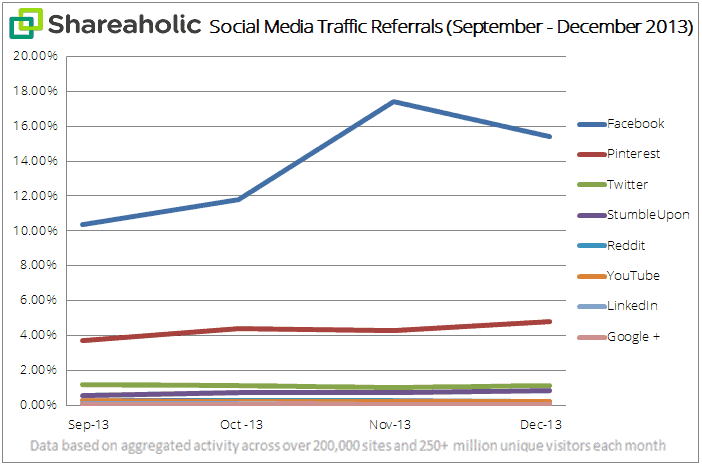
We sought to understand how much traffic the 8 largest social media platforms referred to our network of sites. Below, we’ve presented data for the months of September through December 2013. The numbers in the month columns are represented as “share of visits,” a percentage of overall traffic — direct traffic, social referrals, organic search, paid search, etc. — sites received.* Additionally, we’ve calculated how much each social network’s share of visits grew or declined.
Here is the data, followed by a summary of the 4 main findings:
1) Facebook, Pinterest and StumbleUpon saw the strongest gains. These were the only social platforms to have seen their share of overall visits grow substantially. Facebook’s share grew 48.85% (up 5.07 percentage points), Pinterest’s share grew 30.06% (up 1.11 percentage points) and StumbleUpon’s share grew 54.36% (up 0.30 percentage points). Facebook holds the top spot in the social referrals rankings. Last month, this behemoth of a social network drove more than twice the referrals all 7 of the other social media platforms sent to sites, combined.
2) Twitter’s share was pretty flat. Since September, Twitter’s share of overall visits went down a mere 4.31% (shedding 0.05 percentage points). The preferred hangout for journalists, Twitter maintained its #3 spot on this list.
3) Reddit and YouTube saw (relatively) large dips. Reddit’s share of overall visits shrunk 17.68% since September (losing 0.05 percentage points). In that same time period, YouTube’s share went down 34.97% (-0.10 percentage points).
4) LinkedIn and Google+ are hanging out in last place. LinkedIn’s share was down 26.96% while Google+’s share was up 18.98%. But given their tiny contributions to sites’ overall traffic, these translate to a loss of 0.02 percentage points for LinkedIn and a gain of 0.01 percentage points for Google+. The two now drive roughly the same amount of visits to sites, and were tied last month as the 7th leading source of social traffic.
How have social referrals trended for your site over Q4? By the way, if you enjoy our data reports and don’t want to miss out on the next one, click the image below and subscribe to our blog.
p.s. We’re hiring! See our careers page for more.
* Our data is represented as “share of visits” because the volume of visits (and uniques) our publishers receive changes month-to-month. In September, we tracked 250mm uniques; last month, we reviewed data for 322mm unique visitors. Visits grew by a comparable clip too. Ultimately, sharing our raw data — hundreds of millions of visits — wouldn’t enable site owners to appropriately benchmark their site’s traffic against what sites in our network received.
Want the latest quarterly update to our Social Media Traffic Report? See our most recent Shareaholic studies. Questions? Email us: press@shareaholic.com


