I’m many kinds of geek – social media geek, wine geek and (ironically?) a fitness geek. I track my meals and exercises in this one fitness app, and it gives me charts and weekly reports showing me what foods I ate, what nutrients I got, how many calories I burned and more. And while I love me some data charts, I’m usually left wondering, “Okay…now what?”
I think a lot of people feel that way when they look at their content metrics. What do all of these charts mean? What am I supposed to do with this information?
First things first – think about what questions you are trying to answer, and then dive into your content analytics tool to find the report that provides you with that answer.
These tips will tell you what questions you can answer with common content analytics, and then what steps you can take with those answers.
1. Most Popular Content
What this can teach you:
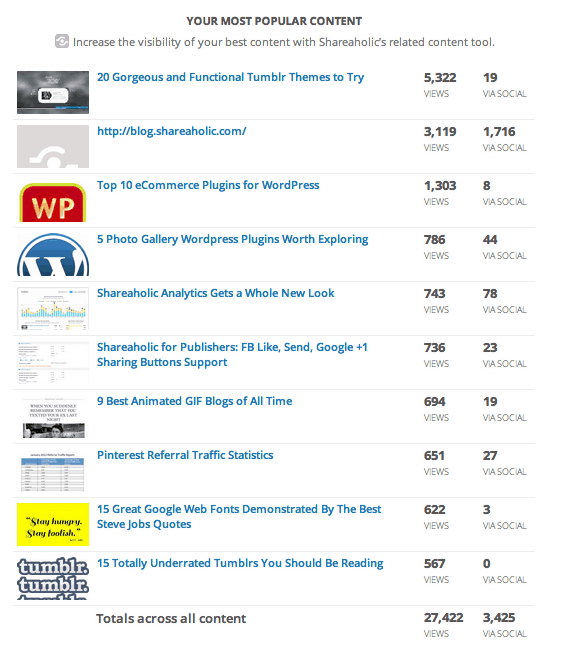
This answers the question “What should I blog about?” loud and clear by showing you what posts perform really well for your audience. There’s a good chance you’ve got some successful posts – evergreen content – that are continuing to send you traffic over and over again. For example, for us, this 20 Gorgeous Tumblr Themes blog post is evergreen on this blog. It’s gotten nearly 4,000 pageviews this month alone, even though we published it back in April. It’s the post that keeps on winning. And there are other more recent posts that also perform particularly well. This report in your Shareaholic analytics will tell you what is working and what isn’t.
What to do with this report:
Now that you know what has worked in the past, think about how you can give it a new spin and plan for that post in your editorial calendar. Also be sure to link to this content often. Use it in calls to action and link to it throughout the new content you create. Include a related content tool like Shareaholic Recommendations, which will automatically recommend more posts like this to your readers under every post.
2. Organic Traffic
In Google Analytics, you can see this report under Traffic Sources > Search > Organic. Your organic traffic report is another area where you can get some blog post ideas.
What this report will tell you:
Your keywords report will show you the search phrases you are ranking for and what your audience is interested in learning about.
What to do with this report:
Take a look at the posts you are doing that are ranking for those keywords and think about why they were successful. Did you optimize your URL and image file name for that keyword? Did it get a lot of Twitter shares? Think about what worked before, and be sure to repeat those things in your future posts.
3. Top Sharers
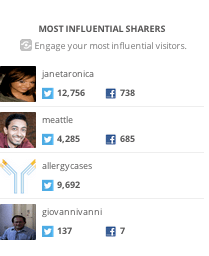
Ever heard of the Pareto Principle? It’s the 80/20 rule: 80% of the effects come from 20% of the causes. A small group of your most influential readers share your content to their friends and followers, generating the majority of your pageviews and future shares.
What this report will tell you: If you want to create shareable content, you need to engage your community of readers. This report from Shareaholic Analytics will show you who your influencers are. No fluffy algorithms to generate this report – it’s based on whose shares are driving traffic to your blog.
What to do with this report:
We’ve included the links to your readers’ social profiles so you can connect with them one-on-one. Follow your top sharers on Twitter, @reply them. Maybe even invite them to guest post. Connect with them, thank them, and grow that community of regular readers who will read and share your content consistently.
4. Traffic Sources
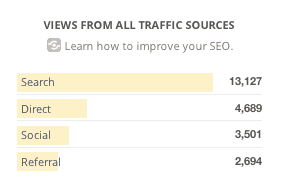
The traffic sources report reveals some “low-hanging fruit.” It’s pretty clear how you can fix things based on this report.
What this report tells you:
The traffic sources report tells you how people are discovering your content. You want a healthy balance of traffic – a diversified traffic acquisition strategy. What is “normal”? It totally depends on your blog. Web analytics master Avinash Kaushik recommends this breakdown:
- Search: around 40%-50%
- Direct: 20%
- Referrals: 20%
- Other: 10%
What to do with this report:
If one of these traffic sources is especially low, stengthen that area of traffic acquisition.
- If your search traffic is low, make sure you are including on-page SEO optimization as part of your content creation strategy.
- If direct traffic is low, make sure you are doing enough to increase awareness for your blog’s brand. PR, plus tactical fixes like optimizing your social sharing buttons to include your Twitter account or branding your most “Pinteresty” blog images like this Shareaholic publisher does are some things that can help.
- If your referral traffic is low, you want to take a hard look at your social media promotion strategy. For starters – do you have a Twitter account? Are you Tweeting your posts? Are you scheduling tweets of your posts? What are the click-through rates on those links? Determine which Facebook page posts get the most engagement and replicate that success. Figure out which social platforms are sending you the most traffic, and really emphasize your time there.
- If your campaign traffic is low, it may be that your paid campaigns (if you are doing them) aren’t as effective as they could be. Re-evaluate who you are targeting and improve this acquisition strategy.
5. Social Referrals
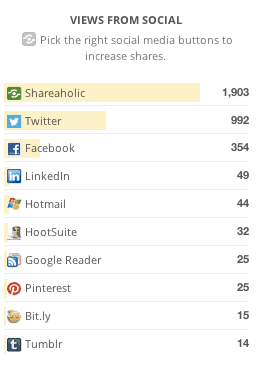
Less is more. Too many sharing options clutter the page and confuse your reader. At Shareaholic, we’ve found that the publishers who overwhelm their readers with dozens of social sharing options are not the ones getting the most shares. The top-shared sites stick to 5 or 6 sharing buttons and focus on the platforms that really matter.
What this report will tell you:
See where you are getting referral traffic from and which platforms your readers are already sharing to.
What to do with this report:
Identify which buttons are really worth featuring on your blog, and create a better content consumption and content sharing experience for your readers by sticking to those. This also shows you where your social media promotion and engagement efforts are actually paying off, and where you should spend more time if you aren’t engaging there a lot already.
You can get the reports I mentioned above for free with Shareaholic’s content sharing and discovery tools right in the WordPress repository. Or, if you just want analytics, you can get the analytics code for Shareaholic analytics.
This is the last in our 3-part series on content analytics. See the other posts:
- How to Engage Your Blog Community With Content Analytics
- How to Kickstart Your Guest Blogging Program With Content Analytics


