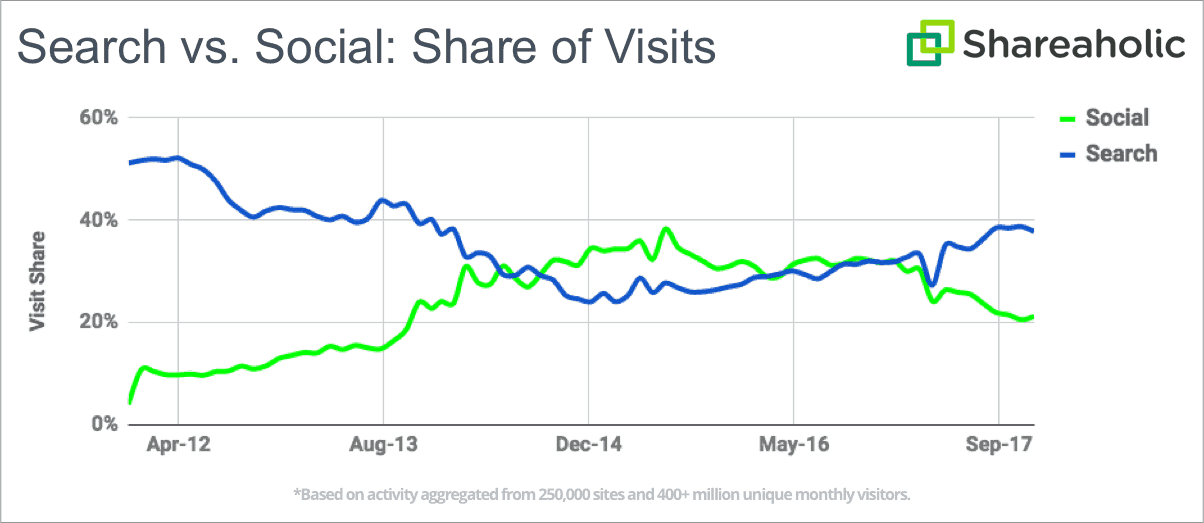
Looking back on 2017, we saw a major tide shift in how sites receive their traffic. After years of strong growth by Social Networks, Search finally had a comeback year and overtook Social as the top traffic driver within our network.
In our newest Shareaholic Traffic Report, we’re looking at externally referred traffic from 400+ million users to 250K+ mobile and desktop sites and analyzing the shifting trends. The data reveals “share of visits,” a percentage of overall traffic — direct traffic, social referrals, organic search, paid search, etc. We source data from a network of opt-in websites that utilize our content marketing and publishing tools. These sites include a diversity of categories (e.g. food, tech, design, fashion and beauty, marketing, sports, parenting, religion, general news, and many more), with sites ranging from independent blogs to publishing companies to commerce sites. The size of websites in the study varies from less than 1,000 monthly unique visitors to over one million. Rather than working with a static list, we take advantage of an expanding data set as we integrate with new sites.
As traffic patterns change, so should your search and social strategies. This report should help you cash in on the major trends heading into 2018.
Search Vs. Social Traffic
A year ago, site visitors were much more likely to be referred from social networks, but now they are increasingly likely to come from search engines. Against all odds, 2017 was the year that Search made a comeback. Since 2014, Search had paced behind Social in share of visits but retook the lead in 2017, driving 34.8% of site visits in 2017, compared to 25.6% from social. The chart below details the monthly share of visits for the 13 top Social networks and 6 Search engines.
At a high level, it is clear that social media’s tenuous grip on being the top referral category is over. After beating out search for the last three years, it has given back the title, driven by changes to the algorithms behind Facebook’s News Feed.
As search engines index more and more social content and include it in their rankings and results pages, it’s no surprise that they’ve been able to stay competitive with the growing volume and consumption of social media. Instead of searching for news and content on individual social networks, users can increasingly find it aggregated within search engines. Google, in particular, benefitted from the changes in social traffic; their dominant market share within search allowed them to reclaim their spot as the #1 overall traffic referrer.
Search Traffic
The rising tide of 2017 raised all of the ships in the Search world, and fairly evenly relative to their previous share. As has been the case for years now, it’s worth paying attention to Bing, but Google is where the money is made and time should be spent.
Social Traffic: Facebook’s Loss is Pinterest and Instagram’s Gain
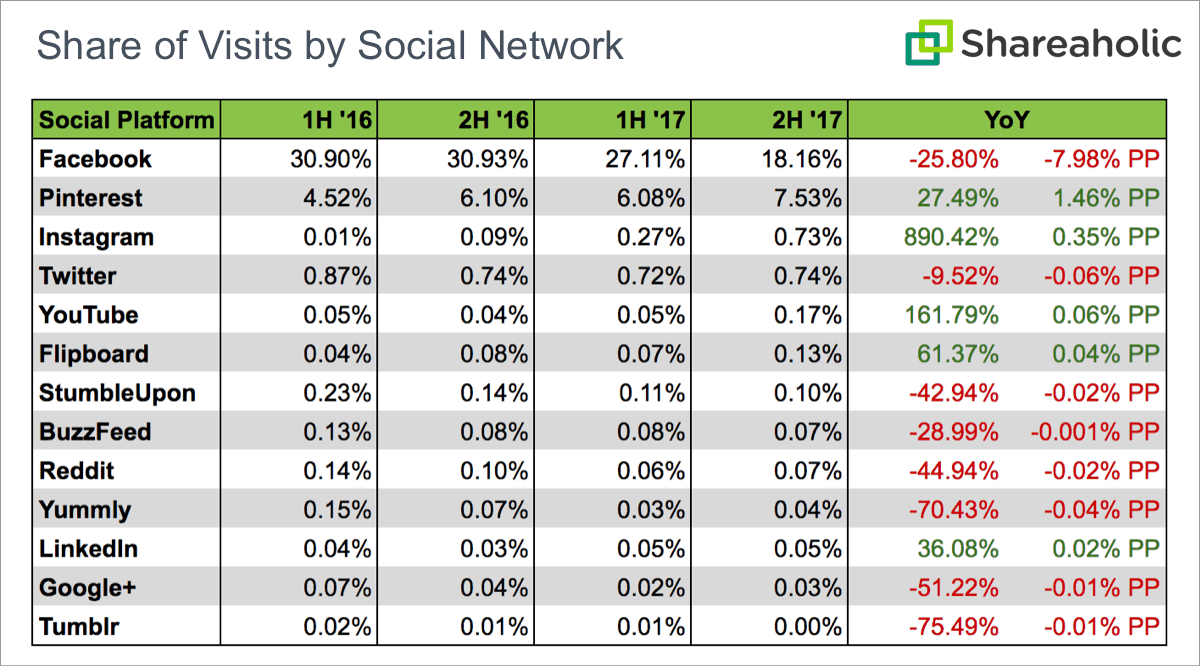
As you might expect, Facebook was the major mover in Social traffic in 2017. Unfortunately, it wasn’t a positive move. Their share of visits dropped a massive 12.7% between the second half of 2016 and the second half of 2017.
After a rocky 2016 US election year, Facebook made a number of major changes to what content they display in the news feed and how they display it. In May 2017 for example, they took aim at sites that “overshare” by posting too frequently, site’s whose pages contain too many ads, and sites that have “little substantive content”.
Additionally, users continued to shift behavior in how much content they consume on Facebook, decreasing their time on site 5%, which totals a staggering 50 million minutes per day. And, according to Social Media Today “per latest data from the social giant, daily watch time for Facebook Live broadcasts has quadrupled in the last year, while time spent watching video on Instagram has increased by 80% in the same period.”
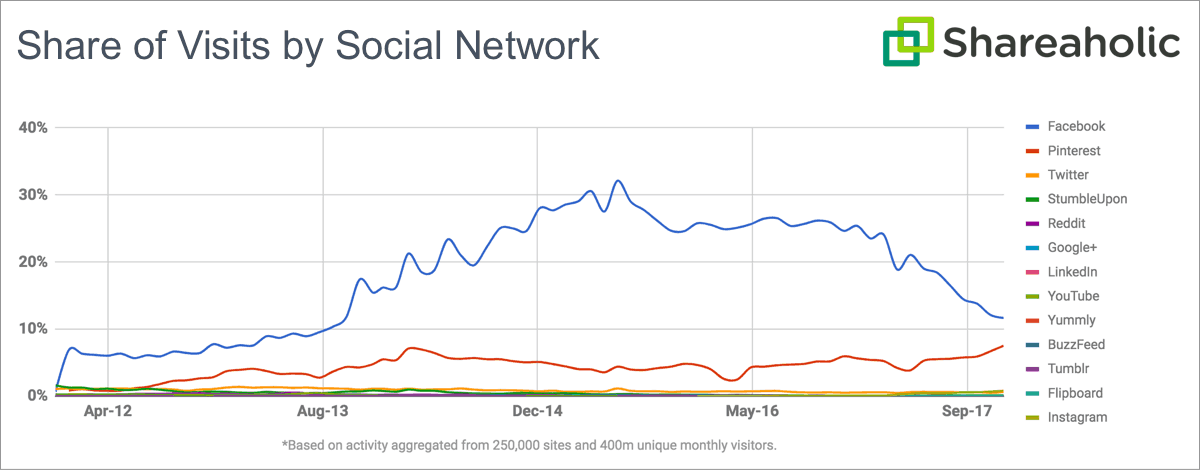
Users are spending less time on Facebook in general, and more time on video and live streaming content which is less likely to link out to other pages, likely causing the dramatic decrease in share seen below.
As you can see, Pinterest and Instagram were the largest beneficiaries of the decrease in Facebook’s share. Instagram has doubled its user base in the past two years. In fact, as of Q2 2017, their growth rate was actually accelerating according to TechCrunch. Additionally, in August of 2017 Instagram rolled out mobile and desktop web functionalities, making their content available to more users in an environment better suited to driving external traffic. All of this makes it an obvious candidate for growth in share of visits, although the almost 10x share growth YoY in 2017 is particularly impressive for a product that doesn’t include many opportunities to link out to other websites.
Pinterest is also a logical beneficiary of Facebook’s decrease in share of visits as their product is predominantly focused on sharing content tied to external sites. Their 1.5% percentage point increase in share of visits YoY is more than double the other growing Social Networks combined. Pinterest’s growth is driven by more than 200 million monthly active users that have saved more than 100B Pins, all of which are opportunities to drive traffic to an external source. The visual discovery engine also sees more than 2 billion searches every month – 85% of which are from mobile devices – and is cashing in on increased Internet traffic with a growing global audience, with more than half of all active users and 75% of new signups coming from outside the U.S.
YouTube, Flipboard, and LinkedIn close out the other big Social winners in share of visits in 2017. LinkedIn rolled out a new look in 2017 which focused heavily on desktop while Flipboard expanded their offering to publishers. They now allow publishers to add RSS feeds through a self-service portal and include non-native mobile web articles. This growth in share of visits aligns well with general trends in traffic to those sites, making it a helpful predictor of how social networks will perform as traffic drivers for your site.
Key takeaways:
- Marketers, publishers and site owners should continue to invest in search. It’s easy to get distracted by the ever-growing list of Social Networks, but at the end of the day, search will continue to be the largest and most efficient traffic driver in 2018. The lack of fragmentation in Search also makes the return on your efforts even more apparent as you only need to focus on one or two platforms.
- In Social, go where the users are. Facebook still has the dominant position, but Instagram and Pinterest are eating into that lead. In fact, Instagram is very close to overtaking Twitter, a traditional staple of these reports, in driving traffic. Make sure that your Instagram and Pinterest profiles are up to date, findable, and chock full of content for users to consume, share, and link out to your site.
- Pinterest and Instagram both focus heavily on image related content, making image sharing a critical component of distributing and driving traffic back to the content and products you create. Make sure that in addition to optimizing content for site performance and SEO, you invest time to include beautiful shareable images for Instagram and Pinterest.
P.S. Interested in learning more about Shareaholic?
Shareaholic is an easy-to-use suite of tools that helps sites of all sizes engage and grow its user base, market content, gain insight, and monetize audiences. Our powerful dashboard aggregates 15+ tools including Social Share Buttons, Related Content, Link Management, Traffic Fraud Reporting, Content Promotion and much much more.


