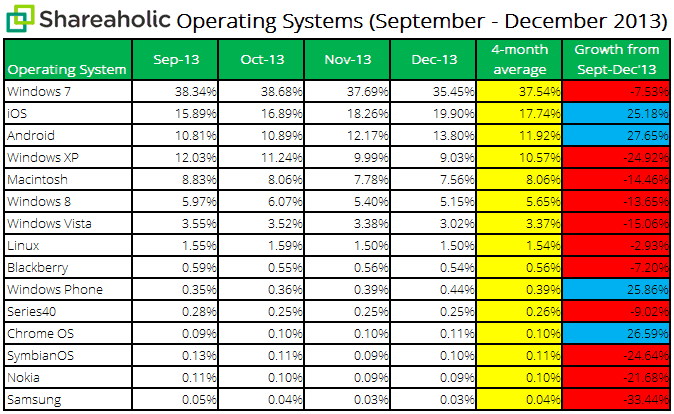
This week, John Gruber (of Daring Fireball fame), pointed out interesting stats about Chrome OS’s web traffic.
Naturally, we were curious. So, we went ahead and crunched our own numbers for OS usage.
Shareaholic, a discovery and sharing platform that helps businesses and publishers effectively promote their content, observes trends across 200,000 websites reaching more than 250mm unique visitors.
Although our sample does not cover the web as a whole, our data set is significantly large enough to identify noteworthy trends. For our Operating System Report, we mined the numbers for 15 different operating systems over 4 months and looked at how their usage trended month-over-month.
Here’s what we did to get the finalized stats presented above:
- Noted the overall number of visits our network of publishers received each month.
- Gathered the number of visits each of the listed operating systems drove to sites each month.
- Divided the volume of visits each OS drove to publishers by the overall number of visits sites using the Shareaholic platform received.
Why is this data important?
It’s worth knowing what OS site visitors are using in case there are any big shifts towards certain operating systems so you can appropriately build flawless web and mobile experiences, and adapt your marketing once you know a bit more about who general visitors are.
Feel free to compare our findings against the numbers StatCounter provides for the same timeframe. Let us know what you think!
If you’re interested in future updates from our blog — data reports, product news, and tips, tricks and advice about content marketing — share your email to subscribe. We promise we’re a spam-free zone.

